-
Identify what your Ruby process is doing
Quick diagnostics of production issues become a lot easier with a direct way to inspect the running process. Ever wondered exactly what the program is doing right now, without adding a lot of slow logging? With this gem in place, you can get full stacktraces for all threads in the system, while the process keeps running, in production. This means you can do this a few of these dumps, and then look for recurring patterns to identify the currently largest bottlenecks. It’s much easier to fix a problem when you know exactly where to look.
Soon you’ll be back on the road to awesome
Simply install and load the
xraygem, then add this to yourGemfile(or similar):gem "xray", require: "xray/thread_dump_signal_handler"Next, you need to start the ruby-process, and find the PID (process identifier):
$ ps ax | grep rubyYou can now invoke:
$ kill -3 1234where
1234is the PID of the ruby process. Note this does not terminate the process. Instead, you immediately see a full stacktrace for current thread written to standard out of the process. If you’re using the Ruby Enterprise Edition runtime, you will get a stacktrace for all threads, a big win. If you are running the process interactively, you see the output directly in the terminal. For service-processes in production, you will need to check the appropriate logfile.Thread dumps for Phusion Passenger with RVM
You can see all running Phusion Passenger instances, including their individual PIDs with this:
$ rvmsudo passenger-statusThen move in for the
kill -3, and have a look at standard out for Passenger. By default on OS X 10.6, this ends up in the file/private/var/log/apache2/error_log, so have a look there. Notice the use ofrvmsudoinstead of regularsudo- this is because I’m using RVM to manage my ruby-versions.I hope you found this useful – what is your stacktrace-aided war-story?
-
Ack! Effortlessly search your codebase
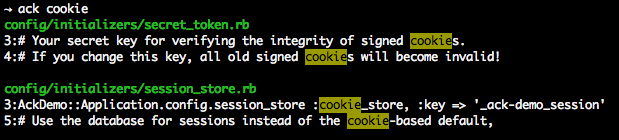
My favorite commandline tool for efficiently searching a codebase is Ack. It shows file:line and highlights the matches in the output. When refactoring a solution it is a trusty companion to quickly find all uses of a method, for instance.
It is easy to install with DarwinPorts:
sudo port install p5-app-ackThis puts the
ackcommand in yourPATHand you’re ready to go.Basic usage of Ack
A recurring task is to find all uses of a method or class in a project. As this is simply a substring search, you invoke Ack with:
ack inconvenience_late_payersand ack quickly starts outputting all the places where this is used. If you add a
-i, the search becomes case-insensitive. Useack --helpto see all the many available options.A bit of configuration goes a long way
Ack is fast because it skips uninteresting files. It is meant for searching for text, and skips version control folders, logfiles, images, and a lot of other stuff you are not interested in when searching through your source-code. However, the backside is you need to configure things once to have support for all your various kinds of source-code.
Adding this small bit of config means
.haml,.sass, and Cucumber.featurefiles are also included when searching.--type-set=haml=.haml --type-set=sass=.sass --type-set=cucumber=.featureWith this in place, you are ready to rock HAML/SSS + Cucumber projects.
Know any extra must-have options or shortcuts I have left out?
Update: added link to official Ack homepage.
subscribe via RSS